This report aims to uncover the relationship between EV fast charging station site performance and nearby amenities, and provide insights into the evolution of EV charging infrastructure.
Paren is the intelligent data layer for the EV industry, used by charging operators, automakers, and infrastructure leaders to understand network performance and charging reliability at scale. For this report, Paren provided the datasets on station characteristics, utilization, reliability, and nearby amenities that make this analysis possible.
Four datasets were leveraged for this report, all reflecting station activity from Q4 2025. Analysis is limited to DC fast charging stations rated 100 kW per port or higher, with rich session data available. The 4,105 stations in our dataset include Electrify America, EVgo, ChargePoint, Ford, IONNA, Applegreen, Red-E, Shell Recharge, FLO, Blink, and Electric Era. This analysis focuses on open-network stations. Tesla Supercharger session data is available through Paren but was outside the scope of this report.
We pivoted the data across three different views:
A wide net: everything within a 5-minute walk. Good for identifying corridor effects and broad retail context.
A tight net: physically adjacent to the station. Immediate parking lot, neighboring storefronts. Most of our deep analysis relies on this view.
A minimalist view that isolates just the immediate amenity. Good for cutting through density effects to identify which anchor matters most.
We use these concepts repeatedly. Here's what they mean and how we calculated them.
Stations that have 11 or more nearby amenities see 7x the utilization of isolated ones. A single anchor, like a big box store, still performs well on its own but amenity variety strongly helps.
Stations near a grocery store see a median of 42 sessions per day, the highest of any amenity type in the dataset. Grocery stores combine high traffic, repeat visits, and dwell times that match a typical fast charge.
In our data set, only 6% of stations sit closest to a grocery store (our top performing amenity in findings). Mall penetration is 3.7%. Pharmacy is 14.5%. These are the amenity types that drive the most utilization, and they're the least represented in today's fast charging network.
Reliable stations see 17 median sessions per day. Unreliable ones see just 3, regardless of what's nearby. An unreliable station is invisible to drivers. They get removed from routing apps and rarely re-tried.
Before we look at performance, here's the mix we're working with. We mapped every business within 0.1 miles of every 100 kW+ station to one of 17 amenity types. Some show up almost everywhere, while others are much rarer.
Quick Serve, Sit-Down, and Coffee show up next to roughly half of all stations. These are the ubiquitous amenities. Big Box, Bank, Fashion Retail, and Grocery sit in the middle, present near roughly a quarter of stations. Pharmacy, Shopping Mall, and Health are the under-penetrated tier, near 14–21% of stations each, despite performing well when they're present.
A great anchor like Walmart or Target performs well on its own. But the biggest performance lever in our entire dataset is amenity density: how many distinct amenities sit within a 2-minute walk of the station.
Charging stations with no amenities nearby see a median of 3 sessions per day. Add some amenities and that jumps up to 9. Add 11+ nearby and the utilization climbs all the way to 28.
The effect scales with density. Stations with 11 or more amenities within 0.1 miles see 28 median sessions per day. That's more than a 7× gap from stations with no nearby amenities.
A small number of amenities isn't a bad site. A standalone Kroger still draws drivers, but a Kroger in a power center with an integrated coffee shop, bank, and pharmacy will do better according to the data. The data shows that drivers are looking for options.
“The data suggests the impact of EV charging extends well beyond the charger itself. The broader retail and economic effects emerging around charging locations are becoming difficult for the market to ignore.”
Real-world examples of how amenity density shows up in actual station performance data.
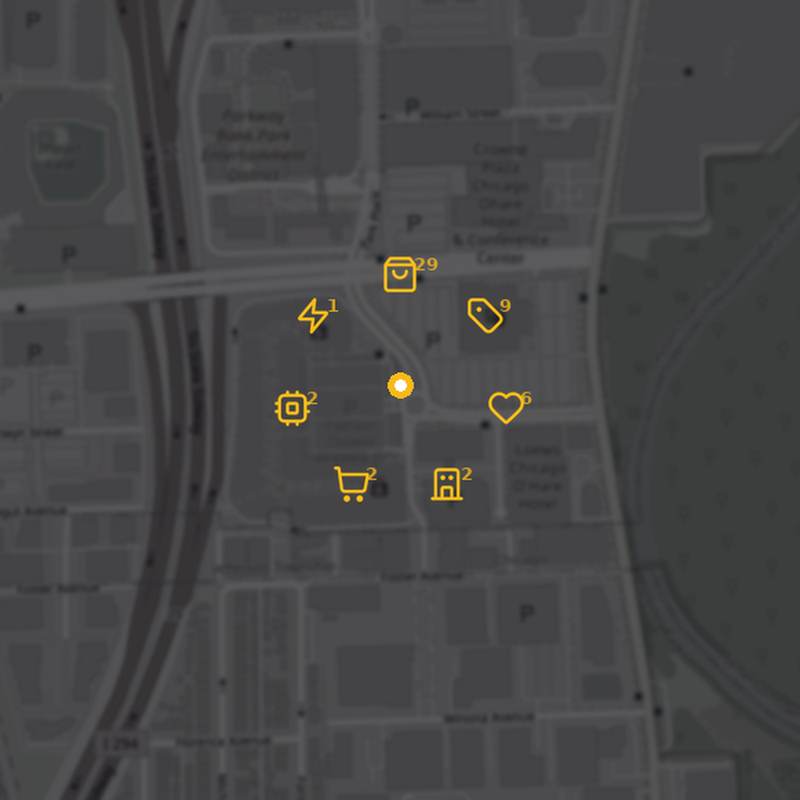
A station with 6 ports sits inside one of the most amenity-dense retail environments in the Midwest. Within 0.1 miles: the outlet mall itself, two major hotels (Crowne Plaza and Loews O'Hare), an entertainment district, and direct Tri-State Tollway access. The station sees 103 median sessions per day, more than 11× the dataset baseline.
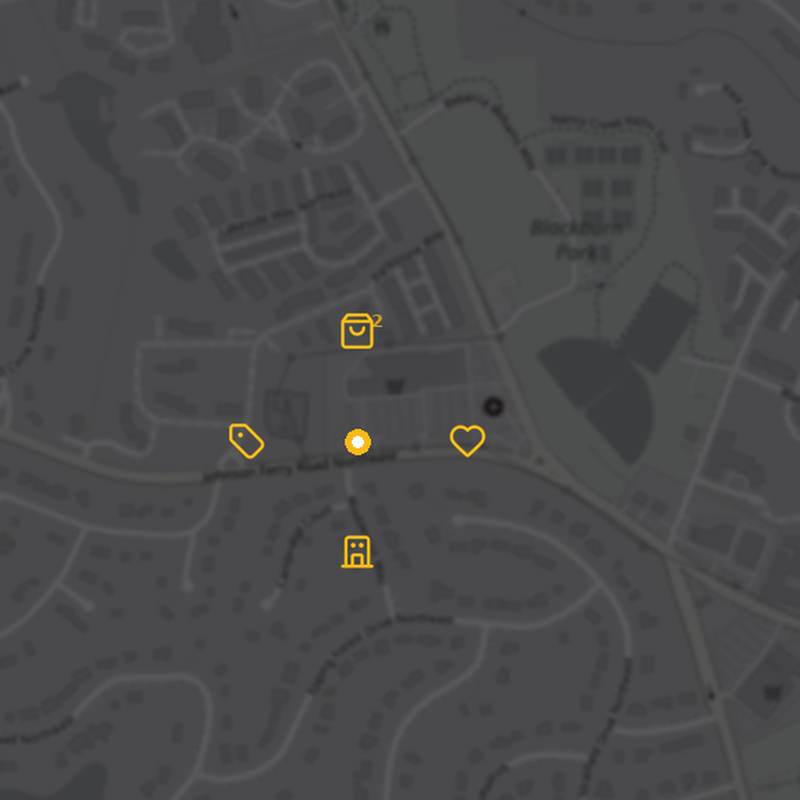
A station with 5 ports sits in a neighborhood shopping center anchored by Publix. Just 5 amenities total within 0.1 miles. Yet the station sees 59 median sessions per day, nearly 7× the dataset baseline.
The grocery store alone is enough. Drivers plan their stop around the shopping trip, and the 25–40 minute charge matches the errand almost exactly.
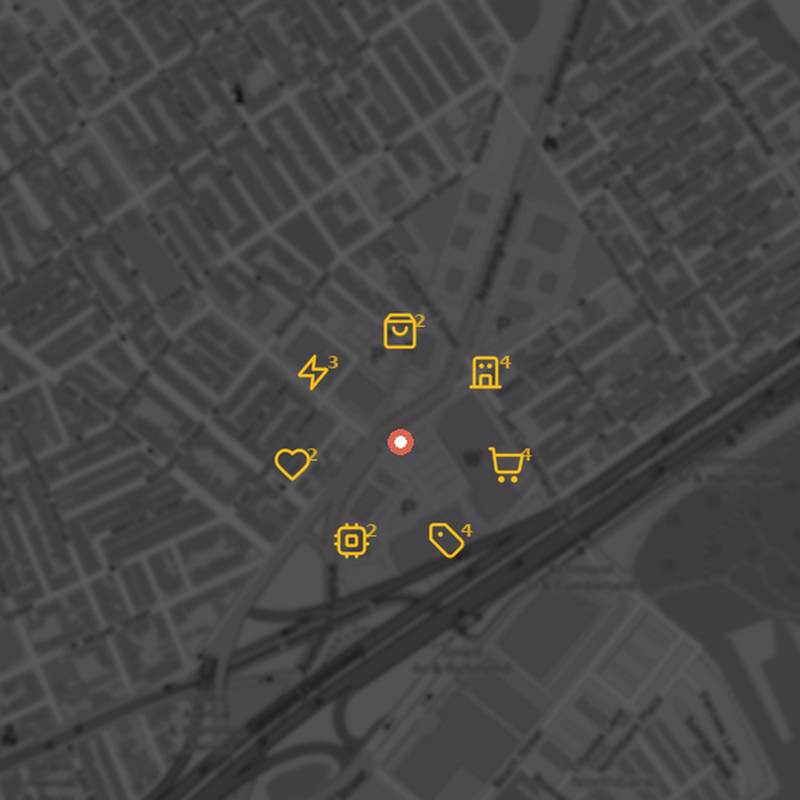
A station sits at the center of a dense urban neighborhood with 21 amenities within 0.1 miles: a grocery store, restaurants, a bottle shop, a GNC, T-Mobile, and more. On paper it is one of the best-located stations in the dataset.
It sees 5.7 median sessions per day. The reliability score is 69.8 out of 100. Drivers encounter failures, routing apps deprioritize it, and the location advantage is almost entirely wasted. A reliable station here would be expected to see 20–30+ SPD based on comparable density profiles in the data.
A fast charging station's reliability score strongly predicts its utilization, and not by a little.
Charger reliability by utilization
| Reliability score | Stations | Median sessions/day |
|---|---|---|
| 90 or higher | 1,438 | 17 |
| Below 90 | 348 | 3 |
That's a 6× gap driven entirely by reliability. The effect is even sharper at the extremes — stations with the worst failure rates see utilization collapse to just 7 sessions per day, regardless of location.
Charging session failure rate by utilization
| Session failure rate | Stations | Median sessions/day |
|---|---|---|
| Under 20% | 1,601 | 33 |
| Over 20% | 185 | 7 |
The hardware and the operator matter as much as the location. A cheaper station with worse uptime doesn't just frustrate drivers, it changes customer habits. Broken stations get demoted or removed from routing apps and are never re-tried.
“In a growing EV market, reliability is no longer a differentiator — it's the baseline expectation shaping customer trust and long-term utilization.”
Of the 17 amenity types we analyzed, grocery sites lead overall utilization. Malls follow as a standout high performer. Both are significantly under-represented in today's fast charging network.
Fast stations near a grocery store see a median of 42 sessions per day, nearly 5× the dataset baseline of 9. The dwell-time match is nearly perfect: a typical grocery run takes 25–40 minutes, which is exactly how long a fast charge takes.
Yet only 6.7% of stations in our dataset sit near a grocery store, making it both the highest-performing and one of the least-represented amenity types in today's network.
Fast stations near a shopping mall see a median of 35 sessions per day, nearly 4× the dataset baseline. The peak we recorded was 102 sessions per day. Malls deliver the heaviest foot traffic, the longest dwell times, and the densest surrounding amenity mix of any retail context.
Only 3.7% of stations are near a shopping mall, the lowest penetration of any top-performing amenity type.
“EV drivers are increasingly charging where they already live, shop, work, and spend time — a trend that is reshaping how the industry thinks about charging deployment.”
Grocery is the lead opportunity. At 42 median SPD, nearly 5× the dataset baseline, yet only 6.7% of stations sit near one. The dwell-time alignment is strong: a typical grocery run matches a typical fast charge almost exactly. Kroger, Safeway, Publix, Whole Foods, and regional chains all fit the pattern.
Malls rank second at 35 median SPD, nearly 4× the baseline, with the lowest station penetration of any top-performing type at just 3.7%. Properties like Westfield, Taubman, and Simon are already seeing disproportionate returns.
Pharmacies rank third at 37 median SPD. With 14.5% station penetration they are the best-represented of the top three amenity types, and still a clear opportunity. CVS, Walgreens, and Rite Aid keep appearing near the highest-performing stations.
Health and Fashion Retail round out the list. Each sees 30+ SPD with very low penetration (1.1% and 3.1%). Small sample sizes make these harder to generalize from, but the signal is consistent.
After analyzing 4,105 fast charging stations, two factors predict utilization more than anything else. The hardware works. And it's surrounded by the right things.
Reliability scores above 90 see 6× the utilization of stations below 90. An unreliable station is invisible to drivers.
Charging stations with at least one amenity within 0.1 miles see nearly 3.5× the median utilization (9 SPD) of charging stations with zero amenities nearby (3 SPD). Even one nearby business gives drivers somewhere to be while their car charges.
Stations with 11 or more amenities within 0.1 miles see 7× the utilization of stations with no nearby amenities. More options means more visits.
All amenities have a positive impact on utilization, but some have a stronger uplift than others. Differentiators (malls, pharmacies, grocery) drive the biggest gains in SPD, while baseline tenants (coffee, QSR, sit-down) help build the surrounding context that makes a site work.
The right fast charging station in the right parking lot is now a traffic driver, a dwell-time extender, and a predictable source of return visits. The question isn't whether to add fast charging. It's whether you'll add it on your terms, or react to a competitor who moved first.
The findings in this report aren't proprietary to Electric Era. They're true of fast charging in American retail, whoever installs it. But if you're evaluating partners, the data points to three things that matter more than most retailers realize:
Underpowered stations force drivers to extend their visit beyond what they planned. For a 20–40 minute grocery run or pharmacy visit, delivering up to 400 kW per port matches driver behavior. Electric Era's RE400 stations are built around that window.
The data shows that reliability is worth 6× utilization. Automated monitoring, remediation, and OTA updates allow providers like Electric Era to catch failures before they frustrate drivers.
When a station fails, the driver automatically thinks less of the retailer whose parking lot they're in. Electric Era's combination of hardware reliability, remote diagnostics, and real-time driver support means that when something goes wrong, drivers are able to successfully charge without giving up on your store.
The same station in the same parking lot can produce very different results for a retailer depending on whether they own it or host it.
In the CPO-owned model, a charging network installs and operates the equipment. The retailer receives a modest site host fee or simply benefits from foot traffic. The CPO controls the pricing, the driver experience, the branding, and the data. For the retailer, the station is essentially a utility in their parking lot, not a business asset.
When a retailer owns the infrastructure, the station becomes part of the store experience. Pricing, loyalty integration, dwell-time promotions, and the driver relationship all stay with the retailer. Session data flows into their own analytics. A failed charge reflects on the retailer's brand regardless of who owns the hardware, but the recovery and the relationship belong to whoever controls the station.
The data in this report describes utilization outcomes, not ownership structure. But the retailers who will capture the most value from high-performing amenity locations are the ones who treat charging as an owned asset, not an outsourced utility. The difference between a grocery store that hosts a station and one that owns a station is the difference between a line item and a competitive advantage.
Electric Era designs, builds, and operates high-performance fast charging stations built around retail dwell times.
Get started